
The float you're trading is not always the float you were shown.
FloatVerify reads the filings behind every small-cap gap — float, ATM shelves, cash and burn — and when two sources disagree, it shows you both numbers instead of picking one.
The 'scanner' predates a filing that changed the float. Both values stay visible, dated.
XMPL · Example Biosciences
NASDAQ| Float (scanner) | 3.2M |
| Price | $4.82 |
| HOD | $5.90 |
| SEC filings | 424B5 |
float scanners
vs SEC filings
A single float number, presented as certain — when it isn't.
Most tools hand you one float, with no date and no source. A filing drops, the real float doubles, and the screen doesn't flinch.
FloatVerify links every number to its exact, dated SEC filing. When two sources diverge, we show you both — in amber — instead of choosing for you.
live data
from the server
What you get, on every gapper
A real example, real data. Sourced float, the session, and every SEC filing linked — dated, clickable. That's what you get every morning, for every stock that gaps.
10-Q · S-1 · 424B5
8-K · 13D/G
Six fields, each traceable to a document.
Float with provenance
Every float figure carries its origin and filing date. Hover any number to see where it came from.
Shelf and ATM detection
S-3, 424B5 and ATM prospectuses read from the filings — the dilution overhang flagged right on the row.
Cash, burn, runway
Latest reported cash and quarterly burn, as months of runway — stated, not modelled into a target.
Disagreement flags
When two sources conflict on a float, both numbers stay on display, in amber. Never an average.
Covered 4am to 8pm
Filings read before the premarket, live tracking through after-hours — where the float really plays out.
One click to the source
Every ticker sheet links to the filings on EDGAR. Nothing here asks you to take our word for it.
live session
What it actually looks like.
Three screens from the running product. Nothing staged — real sessions, real filings, the same numbers you would have seen that morning.
 Open full size
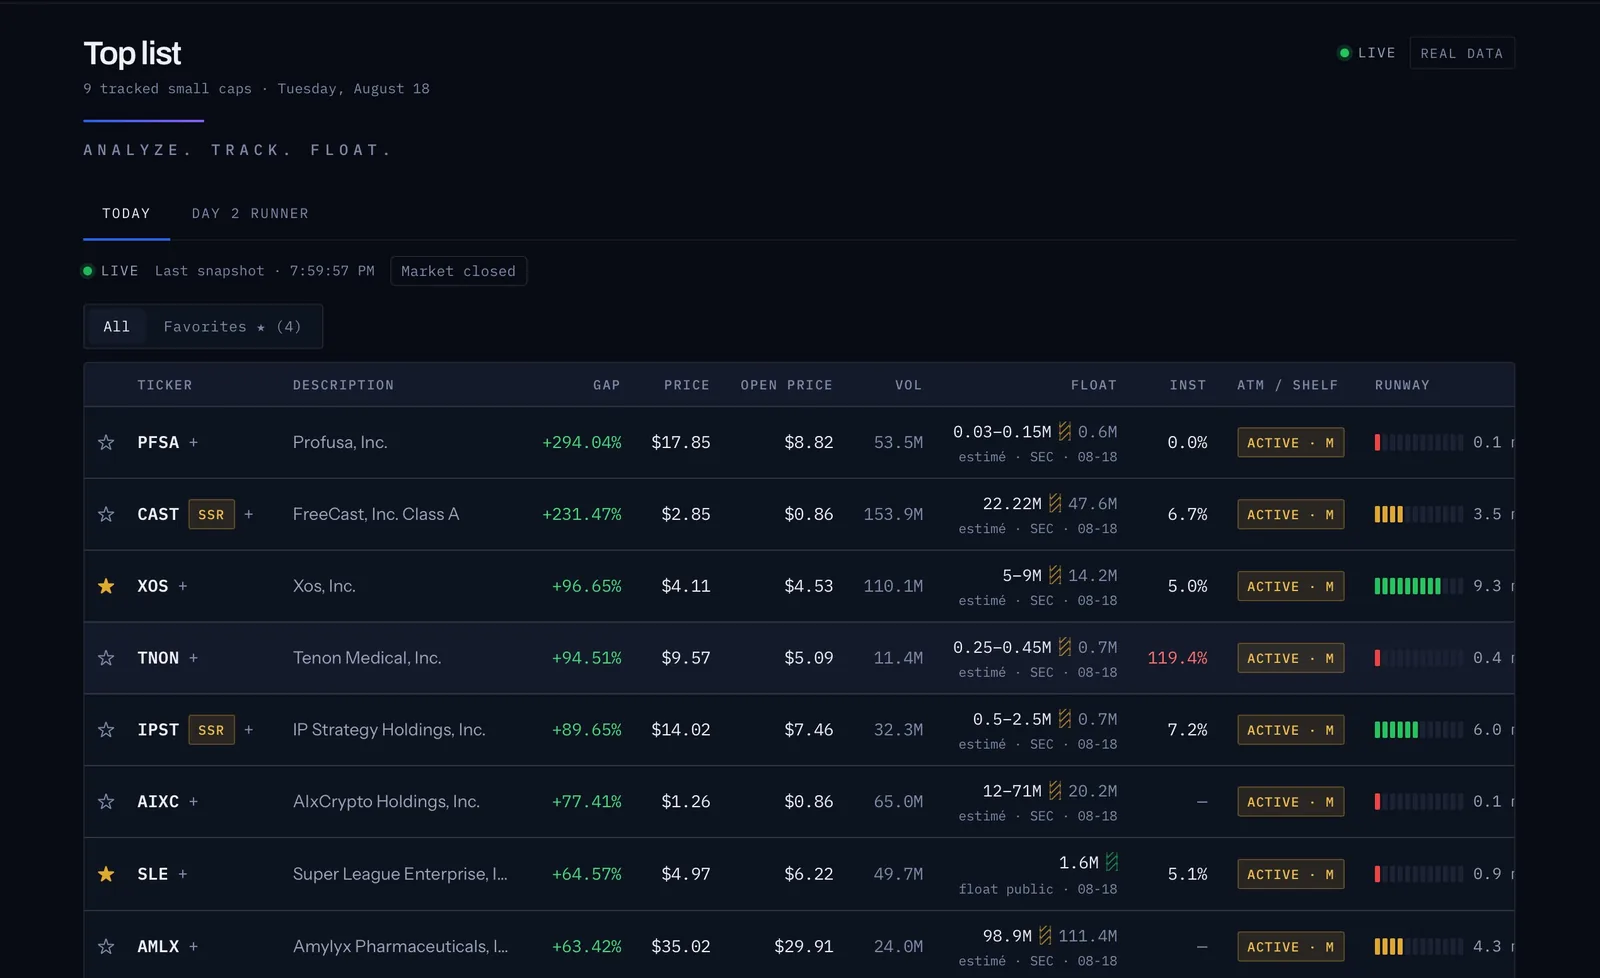
Top list
The session's gappers, each float carrying its measure. Amber hatching means our estimate contradicts the SEC document — both numbers stay on the row, never an average.
 Open full size
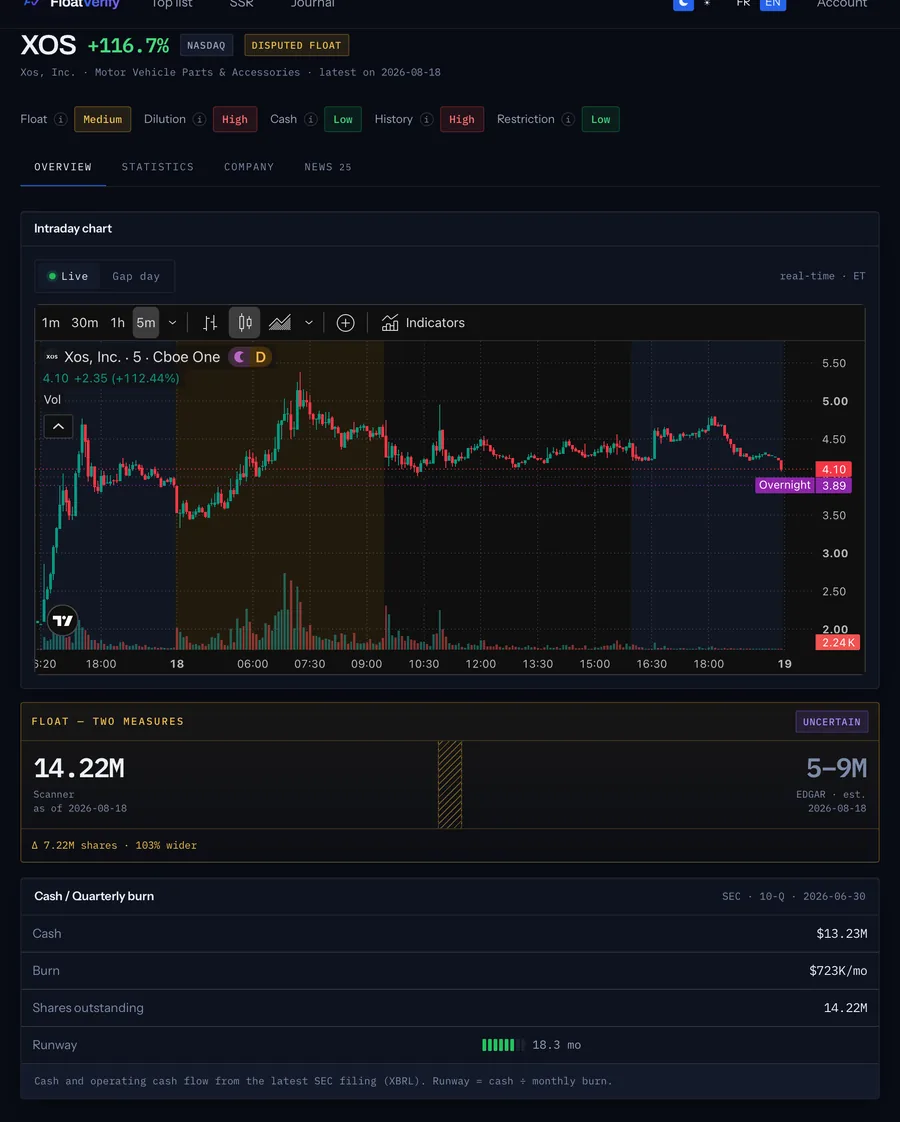
Ticker sheet
Float, dilution, cash and runway read straight out of the filings, stated and dated. A disputed float stays shown as two measures — never an average.
 Open full size
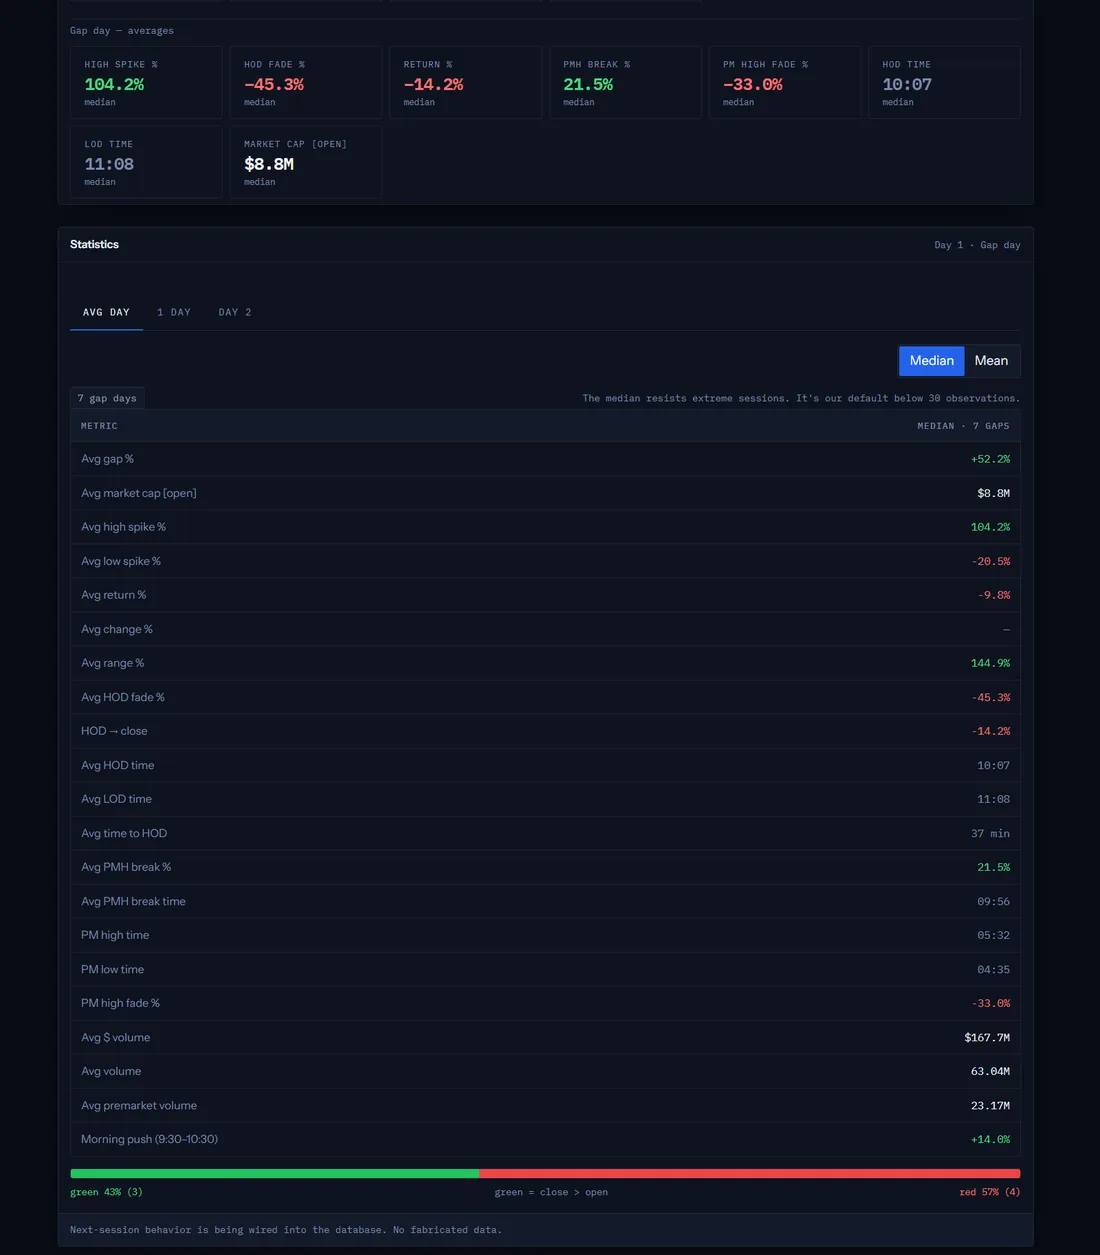
Gap-day statistics
Medians for every metric across archived sessions. Each measure carries its definition — no fabricated data.
no-spin
comparison
Why FloatVerify over another float tool
No spin — what makes us different.
- A single score, presented as certain
- SEC filing monitoring
- Current data only
- No trading strategy
- Numbers with no clear provenance
- Divergence shown in amber — uncertainty, not hidden
- Built for gap-trading: intraday, 4am → 8pm, HOD/LOD/fade
- Backtested history — 4,700+ gaps over 2 years
- Proprietary strategies as alerts — coming soon (advanced tiers)
- Every number sourced and dated, linked to its filing